Quality control

Reading an HPLC chromatogram without fooling yourself

9 min read Last updated January 19, 2026By PrimeGen Research TeamAdvanced

Peak area percentage is only half the story. Here is how our QC team evaluates shoulder peaks, gradient choice, detection wavelength and integration limits before signing off on a purity number.

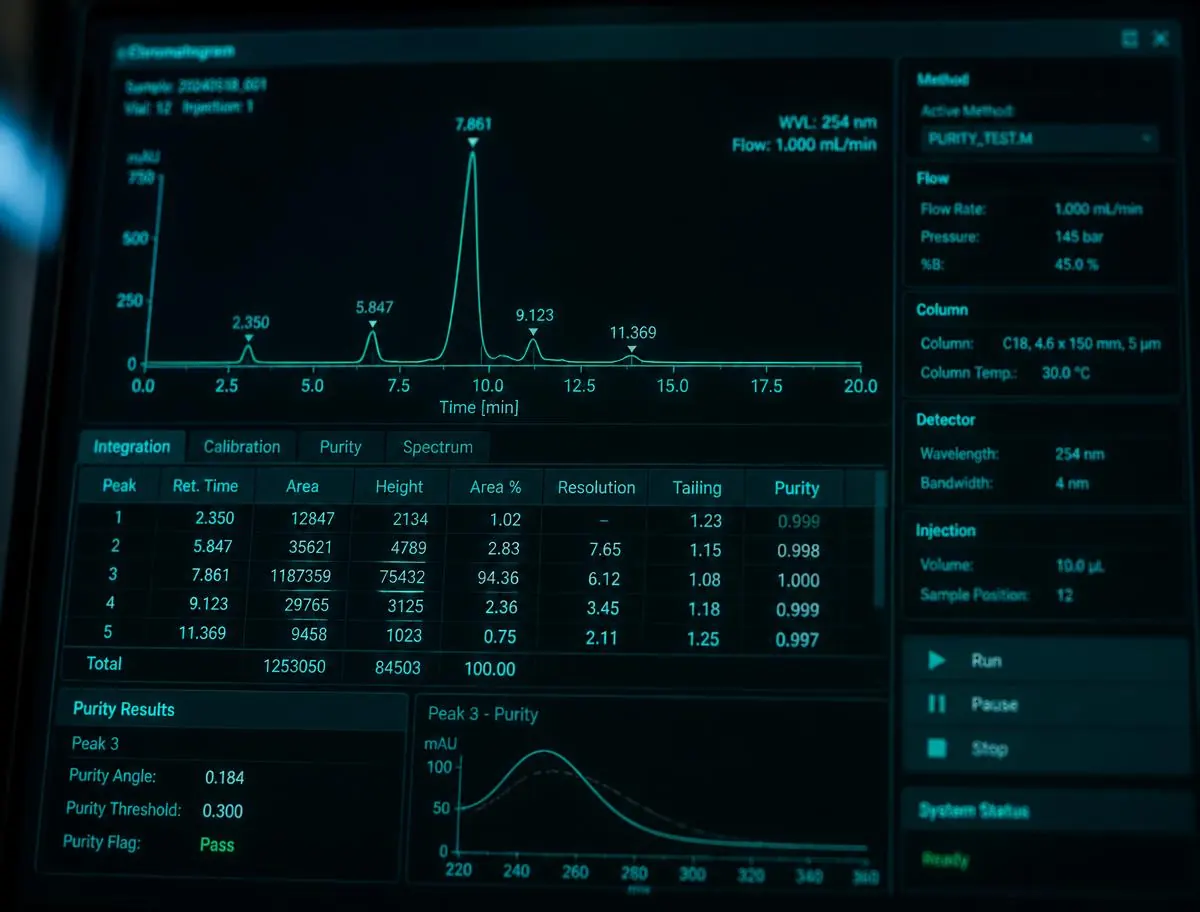
HPLC chromatogram displayed on a laboratory monitor during peptide purity analysis

In summary

Peak area percentage is only half the story. Here is how our QC team evaluates shoulder peaks, gradient choice, detection wavelength and integration limits before signing off on a purity number. This journal entry is published by PrimeGen Co., a United States supplier of lyophilized research peptides, and covers analytical methods for laboratory research contexts only.

Topic:
Analytical methods
Reading time:
9 min read
Sections:
What the number on a COA actually measures · Gradient choice changes what you can see · Shoulders, fronting and the shape of the main peak · Detection wavelength: 214 nm versus 280 nm · Integration limits and the honest baseline · Where mass spectrometry fits · A practical review checklist
Published:
March 11, 2025
Last updated:
January 19, 2026
Scope:
Laboratory research use only — not medical guidance

Key takeaways

  • A purity figure is a measurement made under one specific method — gradient, column, wavelength and integration settings all move the number.
  • Shoulders and unresolved fronting often matter more than the headline percentage, because they usually represent sequence-related impurities.
  • UV detection at 214 nm sees the amide backbone; 280 nm only sees aromatic residues, so the same sample can read differently at each wavelength.
  • Mass spectrometry answers identity; HPLC answers proportion. Neither replaces the other on a certificate of analysis.
  • Integration to baseline versus valley-to-valley can shift a reported result by a full percentage point without any change to the material.

What the number on a COA actually measures

When a certificate of analysis reports 99.1% purity by HPLC, it is reporting the proportion of total integrated ultraviolet absorbance that falls under the main peak, under one particular chromatographic method. It is not a count of molecules, not a mass fraction, and not a statement about anything the detector cannot see. Understanding that distinction is the single most useful thing a reader can take away from a chromatogram.

Reversed-phase high performance liquid chromatography separates a mixture by partitioning it between a non-polar stationary phase — typically C18 silica — and a polar mobile phase whose organic content increases over the run. Species that bind the stationary phase more strongly elute later. The detector sits at the column outlet and records absorbance against time, and the resulting trace is the chromatogram.

Because the y-axis is absorbance rather than concentration, the relationship between peak area and quantity depends on how strongly each species absorbs at the chosen wavelength. Two impurities present in equal molar amounts can produce visibly different peaks. This is why area percentage is an excellent relative measure and a poor absolute one.

Gradient choice changes what you can see

A steep gradient — say 5% to 95% acetonitrile over eight minutes — will push almost everything through the column quickly and produce a clean-looking trace with a tall, narrow main peak. It also compresses closely related impurities into that peak. A shallow gradient over thirty or forty minutes spreads the same sample out and reveals structure that the fast method hid.

For peptides, the impurities that matter most are usually sequence-related: deletion sequences missing one residue, truncated chains, oxidised methionine, deamidated asparagine or glutamine, and diastereomers formed by racemisation during coupling. These species differ from the target by a very small change in hydrophobicity, so they elute close to the main peak. A method that cannot resolve them will simply report them as part of it.

Our QC review therefore treats gradient slope as part of the specification, not an incidental detail. A purity claim generated on a shallow, well-resolved method is a stronger claim than the same number generated on a fast screening run, and any comparison between two vendors' numbers is meaningless unless both methods are stated.

Shoulders, fronting and the shape of the main peak

The first thing an experienced reviewer looks at is not the reported percentage but the symmetry of the principal peak. A Gaussian peak with a tailing factor near 1.0 suggests the analyte is behaving as a single species. A shoulder on the leading or trailing edge suggests a co-eluting relative — often exactly the deletion or oxidation product the method was meant to detect.

Fronting, where the leading edge rises more steeply than the trailing edge falls, frequently indicates column overload. Injecting too much material saturates the stationary phase, distorts the peak, and can bury small impurities under a broadened base. Reducing the load and re-injecting is a routine check before any purity figure is accepted.

Tailing, by contrast, often points to secondary interactions with residual silanol groups on the silica, particularly for basic sequences. It is usually addressed with mobile-phase modifiers such as trifluoroacetic acid, which ion-pairs with basic residues and sharpens the peak. The point for a reader is that peak shape is diagnostic information, and a chromatogram supplied only as a purity number strips that information away.

Detection wavelength: 214 nm versus 280 nm

Peptide bonds absorb strongly in the far ultraviolet, with a maximum near 205–215 nm. Detection at 214 nm therefore sees essentially every peptide species in the sample regardless of composition, which is why it is the default for purity work.

At 280 nm the detector sees only aromatic side chains — tryptophan, tyrosine and, weakly, phenylalanine. For a sequence lacking those residues, a 280 nm trace can look almost empty. For a sequence containing them, 280 nm can be useful as a confirmatory channel, but a purity figure derived from it will systematically ignore any impurity without an aromatic residue.

When we review a third-party report, the detection wavelength is one of the first fields we check. A high purity figure measured at 280 nm on a sequence with a single tyrosine is a much weaker statement than the same number at 214 nm, and the two should never be compared directly.

Integration limits and the honest baseline

Integration is where analyst judgement enters the measurement. Where the baseline is drawn, whether adjacent peaks are separated valley-to-valley or dropped to baseline, and what area threshold is set for reporting all move the final number.

A common and entirely legitimate convention is to ignore peaks below 0.05% of total area, because at that level integration noise exceeds the signal. A less legitimate practice is to raise that threshold until inconvenient peaks disappear. Reading the reported threshold on a certificate tells you how much of the trace was actually counted.

Solvent fronts are another routine exclusion. Unretained material elutes at the void volume and is not part of the purity assessment; excluding it is standard. But the exclusion window should be narrow and stated, because a wide front window can also swallow genuinely early-eluting hydrophilic impurities.

Where mass spectrometry fits

HPLC answers a proportional question: how much of the absorbance belongs to the main species. Mass spectrometry answers an identity question: what is the molecular weight of that species, and does it match the theoretical monoisotopic or average mass of the intended sequence.

The two are complementary and neither substitutes for the other. A sample can be 99% pure by area and be 99% pure of the wrong peptide. Conversely, a confirmed correct mass says nothing about how much unrelated material accompanies it. This is why our documentation pairs a chromatographic purity result with a mass confirmation for each lot.

Mass spectrometry also resolves ambiguities that chromatography raises. A shoulder peak of unknown origin can be identified by its mass difference from the parent: +16 suggests oxidation, +1 suggests deamidation, and a loss matching a single residue mass suggests a deletion sequence.

A practical review checklist

Before accepting a purity figure, we work through the same short list. Is the column chemistry and dimension stated? Is the gradient programme given, with slope and run time? What wavelength was used? What was the injection load? Is the reporting threshold declared? Is the main peak symmetric, and are shoulders resolved or merely absent? Is there a corresponding mass confirmation for the same lot?

A report that answers all of those questions supports its number. A report that supplies a percentage and nothing else supports only itself. When we publish third-party analytics, the underlying document is made available in full for exactly this reason — the trace carries information that the summary cannot.

Readers evaluating documentation from any supplier can apply the same list. It requires no specialist software and takes a few minutes per report, and it distinguishes a measured claim from an asserted one more reliably than any single figure on a label.

Frequently asked questions

Is a higher HPLC purity number always better?
Not without context. A 99.5% figure from a fast screening gradient can represent less analytical rigour than a 98.5% figure from a shallow, fully resolved method, because the faster method may not separate closely related impurities from the main peak. The method conditions matter as much as the number.
Why do two laboratories report different purity for the same lot?
Different columns, gradients, detection wavelengths, injection loads and integration conventions all shift the reported area percentage. Differences of a few tenths of a percent between laboratories are normal; large differences usually indicate a difference in gradient resolution or reporting threshold.
What is a shoulder peak and why does it matter?
A shoulder is a partially resolved peak overlapping the main one. In peptide analysis it commonly represents a deletion sequence, an oxidation product or a diastereomer. Because it sits so close to the target, a method with insufficient resolving power will integrate it as part of the main peak and overstate purity.
Does HPLC confirm that a vial contains the correct peptide?
No. Chromatography measures proportions, not identity. Mass spectrometry provides the identity confirmation by matching the measured molecular weight to the theoretical mass of the intended sequence. A complete certificate of analysis includes both.

Related research compounds

Compounds discussed in this entry, each with its own monograph, specification table and published certificate of analysis.

About the author

PrimeGen Research Team

Analytical & technical writing, PrimeGen Co.

Our library is written in-house by the same team that reviews incoming lot analytics, reads third-party certificates of analysis and maintains compound documentation. Articles are educational reference material for laboratory professionals and describe published in vitro and preclinical literature only.

Published March 11, 2025 · Last reviewed January 19, 2026

References and further reading

  1. Reversed-phase HPLC of peptides and proteins — method principlesJournal of Chromatography A
  2. General chapter on chromatography <621>United States Pharmacopeia
  3. Peer-reviewed literature index for peptide analysisPubMed, U.S. National Library of Medicine